Departmental Performance Report 2011-2012
Go back to Program Activity Architecture
Due from Consolidated Revenue Fund - $141.2M (26%)
Accounts receivable and advances - $15.3M (3%)
Prepaid expenses - $1.6M (0%)
Inventory - $4.3M (1%)
Tangible capital assets - $381.3M (70%)
Actual Spending (Total)
- 2009-2010 -1,095
- 2010-2011 -1,089
- 2011-2012 -1,008
Planned Spending (Total)
- 2012-2013 -1,025
- 2013-2014 -910
- 2014-2015 -850
Weather and Environmental Services for Targeted Users - $67.4M (6%)
Biodiversity - Wildlife and Habitat - $146.3M (13%)
Weather and Environmental Services for Canadians - $178.5M (16%)
Substances and Waste Management - $139.0M (12%)
Climate Change and Clean Air - $128.6M (11%)
Water Resources - $131.3M (12%)
Compliance Promotion and Enforcement - Pollution - $48.0M (4%)
Compliance Promotion and Enforcement - Wildlife - $20.3M (2%)
Sustainable Ecosystems - $69.0M (6%)
Internal Services - $210.9M (18%)
Program Activities for Strategic Outcome 1
- 1.1 Biodiversity - Wildlife and Habitat
- 1.2 Water Resources
- 1.3 Sustainable Ecosystems
- 1.4 Compliance Promotion and Enforcement-Wildlife
Program Activities for Strategic Outcome 2
- 2.1 Weather and Environmental Services for Canadians
- 2.2 Weather and Environmental Services for Targeted Users
Program Activities for Strategic Outcome 3
- 3.1 Substances and Waste Management
- 3.2 Climate Change and Clean Air
- 3.3 Compliance Promotion and Enforcement -Pollution
Program Activities for Internal Services
- 4.1.1 Governance and Management Support (includes Management and Oversight, Communications, and Legal)
- 4.1.2 Resource Management Services (includes Human Resources Management, Financial Management, Information Management, Information Technology, and Travel and Other Administrative Services)
- 4.1.3 Asset Management Services (includes Real Property, Materiel, and Acquisition)
Accounts payable and accrued liabilities - $161.5M (36%)
Vacation pay and compensatory leave - $29.6M (7%)
Deferred revenue - $6.4M (1%)
Lease obligation for tangible capital assets - $12.9M (3%)
Employee future benefits - $98.1M (22%)
Environmental liabilities - $107.6M (24%)
Other liabilities - $34.0M (7%)
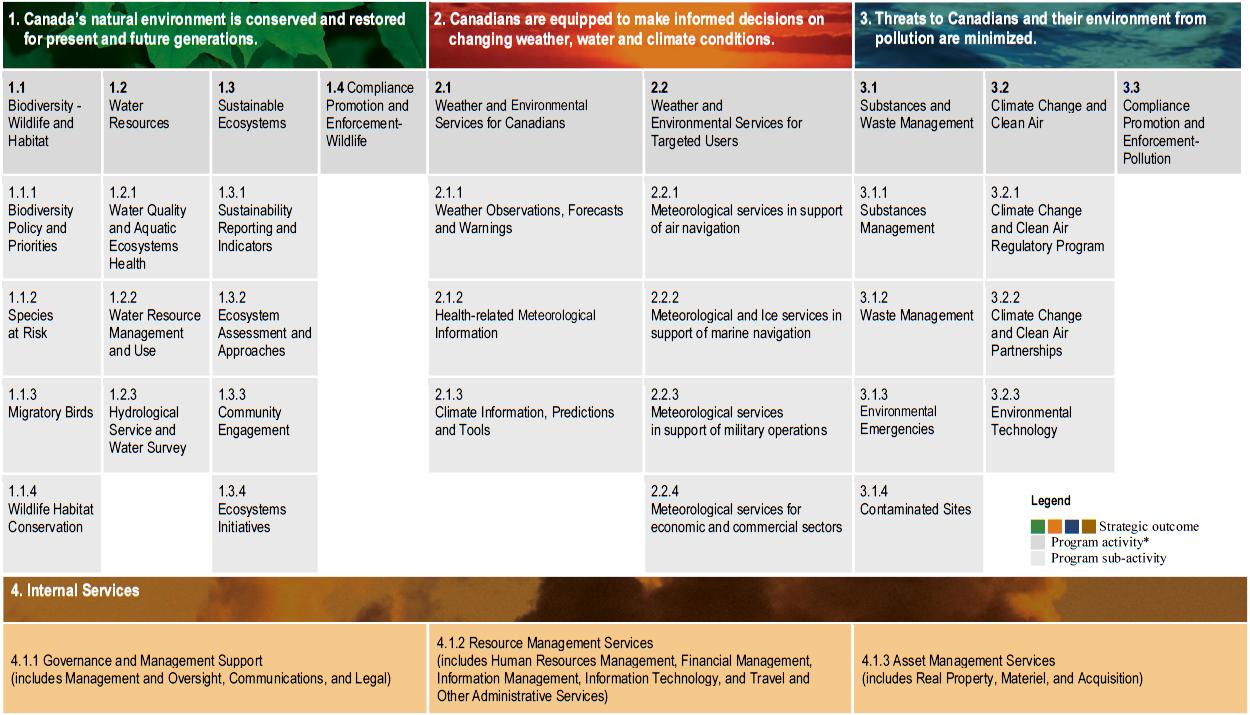
2011–2012 Environment Canada Program Activity Architecture
- 1. Canada's natural environment is conserved and restored for present and future generations.
- 1.1 Biodiversity - Wildlife and Habitat
- 1.1.1 Biodiversity Policy and Priorities
- 1.1.2 Species at Risk
- 1.1.3 Migratory Birds
- 1.1.4 Wildlife Habitat Conservation
- 1.2 Water Resources
- 1.2.1 Water Quality and Aquatic Ecosystems Health
- 1.2.2 Water Resource Management and Use
- 1.2.3 Hydrological Service and Water Survey
- 1.3 Sustainable Ecosystems
- 1.3.1 Sustainability Reporting and Indicators
- 1.3.2 Ecosystem Assessment and Approaches
- 1.3.3 Community Engagement
- 1.3.4 Ecosystems Initiatives
- 1.4 Compliance Promotion and Enforcement-Wildlife
- 1.1 Biodiversity - Wildlife and Habitat
- 2. Canadians are equipped to make informed decisions on changing weather, water and climate conditions.
- 2.1 Weather and Environmental Services for Canadians
- 2.1.1 Weather Observations, Forecasts and Warnings
- 2.1.2 Health-related Meteorological Information
- 2.1.3 Climate Information, Predictions and Tools
- 2.2 Weather and Environmental Services for Targeted Users
- 2.2.1 Meteorological services in support of air navigation
- 2.2.2 Meteorological and Ice services in support of marine navigation
- 2.2.3 Meteorological services in support of Military operations
- 2.2.4 Meteorological services for economic and commercial sectors
- 2.1 Weather and Environmental Services for Canadians
- 3. Threats to Canadians and their environment from pollution are minimized.
- 3.1 Substances and Waste Management
- 3.1.1 Substances Management
- 3.1.2 Waste Management
- 3.1.3 Environmental Emergencies
- 3.1.4 Contaminated Sites
- 3.2 Climate Change and Clean Air
- 3.2.1 Climate Change and Clean Air Regulatory Program
- 3.2.2 Climate Change and Clean Air Partnerships
- 3.2.3 Environmental Technology
- 3.3 Compliance Promotion and Enforcement-Pollutions
- 3.1 Substances and Waste Management
- 4. Internal Services
- 4.1.1 Governance and Management Support (includes Management and Oversight, Communications, and Legal)
- 4.1.2 Resource Management Services (includes Human Resources Management, Financial Management, Information Management, Information Technology, and Travel and Other Administrative Services)
- 4.1.3 Asset Management Services (includes Real Property, Materiel, and Acquisition)
Note: On February 16, 2011, responsibility for the Mackenzie Gas Project (MGP) and the Federal Public Administration MGP Office was transferred to the Minister of Aboriginal Affairs and Northern Development. Please see the Canada Gazette for more information.
There are Sub-sub-activities under these programs that have not been identified in this graphic.
Sales of goods and services - $57.1M (78%)
Other revenues earned on behalf of Government - $8.4M (11%)
Sales of goods and services earned on behalf of Government - $5.1M (7%)
Other revenues - $2.9M (4%)
Environment Canada's Spending Trend ($ Millions)
2009-2010
- Main Estimates -993
- Planned Spending -993
- Total Authorities -1,174
- Actual Spending1 -1,095
- Canada's Economic Action Plan -18
2010-2011
- Main Estimates -1,094
- Planned Spending -1,094
- Total Authorities -1,172
- Actual Spending1 -1,089
- Canada's Economic Action Plan -17
2011-2012
- Main Estimates -872
- Planned Spending -872
- Total Authorities -1,099
- Actual Spending -1,008
1 Actual spending includes Canada's Economic Action Plan displayed separately for information purposes.
- Date modified: