Departmental Performance Report 2012-2013
Section III: Supplementary Information
- Financial Statements Highlights
- Supplementary Information Tables
- Tax Expenditures and Evaluations Report
Financial Statements Highlights
The financial highlights presented on the following pages offer an overview of Environment Canada’s Statement of Operations and Departmental Net Financial Position and Statement of Financial Position. The detailed Unaudited Departmental Financial Statements can be found on Environment Canada’s website.
Condensed Statement of Operations and Departmental Net Financial Position
| 2012–2013 Planned Results | 2012–2013 Actual | 2011–2012 Actual | $ Change (2012–2013 Planned vs. Actual) | $ Change (2012–2013 Actual vs. 2011–2012 Actual) | |
|---|---|---|---|---|---|
| Total expenses | 1,145.3 | 1,100.3 | 1,139.4 | 45.0 | (39.1) |
| Total revenues | 67.8 | 84.9 | 60.0 | (17.1) | 24.9 |
| Net cost of operations before government funding and transfersFootnote a | 1,077.5 | 1,015.4 | 1,109.7 | 62.1 | (94.3) |
| Departmental net financial position | 135.6 | 143.6 | 93.6 | (7.8) | 50.0 |
Footnotes
- Footnote a
The net cost of operations before government funding and transfer, in 2011–2012, includes $31.5 million in expenses and $1.3 million in revenues deemed to have been recorded by Shared Services Canada (SSC).
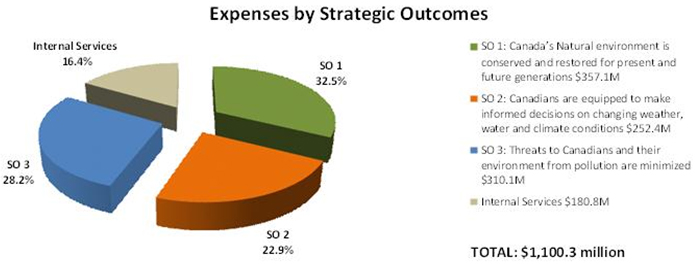
Expenses by Strategic Outcomes
Total departmental expenses by Strategic Outcomes amounted to $1,100.3 million for 2012–2013. The decrease of $39.1 million or 3.4%, from $1,139.4 million in 2011–2012 to $1,100.3 million in the current fiscal year is mostly due to
- The implementation of new streamlining and efficiency measures to reduce operating and program costs in order to meet the Canada’s Economic Action Plan objectives;
- Increased responsibilities transferred to Shared Services Canada; and,
- New fast start financing under the Copenhagen Accord as well as an offsetting decrease in Nature Conservancy of Canada (NCC) funding contributed to a $29.8 million transfer payment increase.

See Note 15 of the Departmental Financial Statements for further breakdown of expenditures–Segmented information by Standard Objects and Strategic Outcomes.
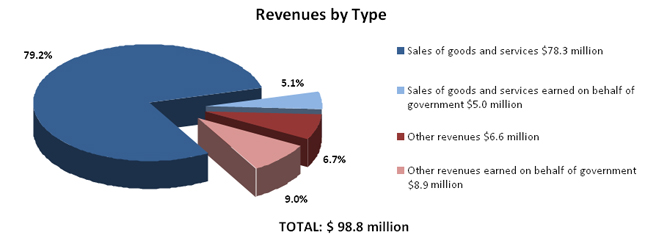
Revenues by Type
Total revenues amounted to $84.9 million for 2012–2013. This amount excludes $13.9 million of revenues earned on behalf of government. The majority of the revenue in 2012–2013 is derived from Environment Canada (Meteorological Service of Canada) under Strategic Outcome 2 and comprises items such as ocean disposal permit applications, meteorological services, hydraulics laboratory and ocean disposal monitoring fees.
The increase of $24.9 million or 41.5% in Environment Canada’s net revenues in 2012–2013 is due to Oil Sands Monitoring Plan activities and revenues recorded from joint projects and cost-sharing agreements, mainly attributable to a project for the Peninsula Harbour Sediment Remediation (agreement between the Government of Canada and the Province of Ontario, Great Lakes Area).

See Note 15 of the Departmental Financial Statements for further breakdown of revenues–Segmented information by type and Strategic Outcomes.
Condensed Statement of Financial Position
| 2012–2013 | 2011–2012 | $ Change | |
|---|---|---|---|
| Total net liabilities | 419.2 | 450.0 | (30.8) |
| Total net financial assets | 163.7 | 156.5 | 7.2 |
| Departmental net debt | 255.5 | 293.5 | (38.0) |
| Total non-financial assets | 399.1 | 387.2 | 11.9 |
| Departmental net financial position | 143.6 | 93.7 | 49.9 |
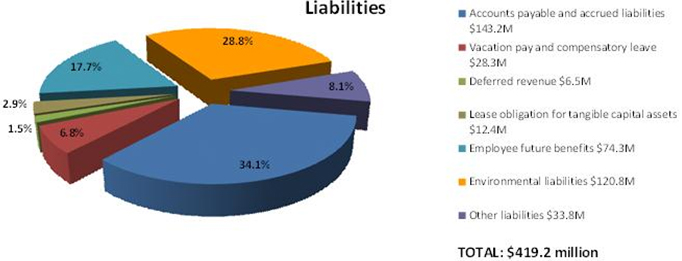
Liabilities by Type
Total liabilities were $419.2 million at the end of 2012–2013. This represents a decrease of $30.8 million or 6.8% from the previous year’s total liabilities of $450.0 million. The accounts payable and accrued liabilities and environmental liabilities represent the largest component of liabilities at $264.0 million (63.0% of total liabilities) in 2012–2013.
The decrease in Environment Canada’s total net liabilities valuation is mainly attributable to
- An overall reduction of accrued liabilities, including a $24.0 million reduction related to a payment to Nature Conservancy of Canada and a $12.0 million reduction related to the disclosure of the obligation for termination benefits associated with the estimated workforce adjustment costs; and
- A decrease of $23.7 million in liabilities related to employee future benefits explained by the abolition of severance pay in some classifications.
These reductions are offset by
- An increase of the accounts payable to external parties by $17.1 million; and
- An increase of $13.2 million in environmental liabilities due to new liabilities of $12.8 million related to the Mould Bay site.

See Notes 4 to 8 and Note 12 of the Departmental Financial Statements for more details–Accounts payable and accrued liabilities; Deferred revenue; Lease obligation for tangible capital assets; Employee future benefits; Environmental and contingent liabilities; Contractual obligations.
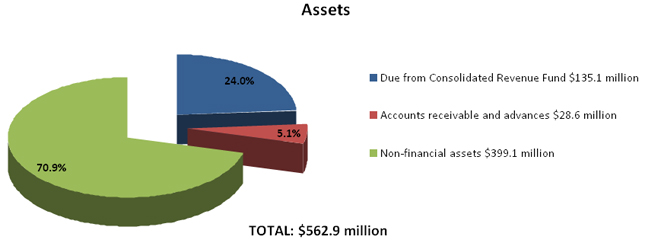
Assets by Type
Total assets, valued at $562.8 million, have increased by $19.1 million or 3.5% in the 2012–2013 fiscal year. The tangible capital assets continue to represent the largest component of assets, at $389.5 million (69.0% of total assets) in 2012–2013.
The increase in Environment Canada’s total net assets valuation is mainly attributable to the following.
Financial Assets
- A decrease of $6.1 million due from the Consolidated Revenue Fund; and
- An increase of $13.7 million in accounts receivable and advances mainly due to the invoicing for the Oil Sands Monitoring Plan.
Non-Financial Assets
- An increase of $4.0 million of the inventory; and
- An increase of $8.2 million in tangible capital assets; the major acquisitions were for machinery and equipment and assets under construction.

See Notes 9 to 11 of the Departmental Financial Statements for more details – Accounts receivable and advances; Inventory; Tangible Capital Assets.
Financial Statements
Environment Canada’s unaudited financial statements are prepared in accordance with Treasury Board Secretariat policies that are based on Canadian public sector accounting standards and, therefore, are different from appropriation-based reporting, which is reflected in Sections I and II of this report. Sections I and II are prepared on a modified cash basis, and not an accrual basis. A reconciliation between Parliamentary Appropriations used (modified cash basis) and the Net Cost of Operations (accrual basis) is set out in Note 2 and 3 of Environment Canada’s Unaudited Financial Statements at this website.
Supplementary Information Tables
The following tables are provided electronically at Environment Canada’s websiteas part of the Department’s 2012–2013 DPR:
- Details on Transfer Payment Programs
- Greening Government Operations
- Horizontal Initiatives
- Internal Audits and Evaluations
- Responses to Parliamentary Committees and External Audits
- Sources of Respendable and Non-Respendable Revenue
- Status Report on Projects Operating with Specific TB Approval
- Up-front Multi-year Funding
- User Fees Reporting
Tax Expenditures and Evaluations Report
The tax system can be used to achieve public policy objectives through the application of special measures such as low tax rates, exemptions, deductions, deferrals and credits. The Department of Finance publishes cost estimates and projections for these measures annually in the Tax Expenditures and Evaluations publication. The tax measures presented in the Tax Expenditures and Evaluations publication are the sole responsibility of the Minister of Finance.
- Date modified: