Canada's top ten weather stories of 2013
- 2013 - A Year in Review
- 1. Alberta's Flood of Floods
- 2. Toronto's Torrent
- 3. Bumper Crops in the West, So-So for the Rest
- 4. The Nightmare during Christmas
- 5. To Flood or Not to Flood?
- 6. Rebound in the Arctic Ocean and the Great Lakes
- 7. Wicked Winter Weather Wallops the East
- 8. Spring Flooding in Ontario’s Cottage Country
- 9. Prairie Winter Went on Forever
- 10. Stormy Seas and Maritime Tragedy
- Runner-up Stories
- Atlantic Regional Highlights
- Quebec - Regional Highlights
- Ontario - Regional Highlights
- Prairie Provinces - Regional Highlights
- British Columbia - Regional Highlights
- The North - Regional Highlights
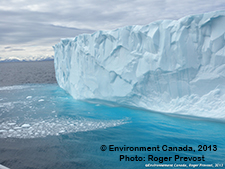
6. Rebound in the Arctic Ocean and the Great Lakes

Arctic sea ice continued to make news in 2013. Satellite observations from the European Space Agency showed that in March and April – typically the time when the ice floes are at their thickest – the sea ice cap was larger than a year ago, but the volume (area x thickness) continued to decline as it has each year since 1979. Hitting a new record low in spring 2013, it was now half the volume that it was 30 years ago. Further, the University of Colorado at Boulder, Colorado reported that multi-year ice more than four years old decreased from 18 per cent of the March peak ice cover in 1984 to three per cent in 2013. There was also some shipping news. China reported that, for the first time, one of its cargo ships had successfully plied the waters of the Northeast Passage along the northern coast of Russia, effectively cutting two weeks from its conventional route to the Netherlands. And just a week later, a Danish-owned cargo ship sailed for the first time through the Northwest Passage without incident.
There was even bigger news in September – a time when sea ice coverage usually reaches its minimum. While summer ice coverage varies widely from area to area and year to year, the US National Snow and Ice Data Center (NSIDC) reported that ice extents this year had recovered to somewhat closer to normal given that last September the ice cover shrunk to its lowest extent since satellite records began 34 years ago. Still, the ice was more than a million square km less than the 30-year average − the sixth smallest extent ever recorded and half of what the concentration was in the 1950s. Clearly, ice melting was slowed by cooler summer air temperatures and more cloud cover over most of the central Arctic Ocean, Greenland and the Canadian Archipelago. According to the NSIDC, summer air temperatures in the lower atmosphere were 0.5 to 2.0°C below average. Wind and storm patterns also affect ice conditions. In summer 2013, favourable winds caused the ice cover to spread out and cover a larger area.
In 2013, as reported by the Canadian Ice Service of Environment Canada, sea ice coverage in Canadian arctic waters (not including Hudson Bay) reached a minimum of 27.2 per cent (or 0.76 million square km) during the week of September 3. That’s only 2.8 per cent less than the 1981-2010 normal minimum coverage and the most ice coverage at the summer minimum point since 2005. In the Canadian portion of the Arctic Ocean, limited heat transport from the south slowed the ice melt and new ice began forming in the northern reaches near the end of August. Although the southern route of the Northwest Passage has been navigable since 2006, certain sections were difficult to navigate this year – just as they were in 2009 – and the northern route was closed to all ships except icebreakers. At the peak of ice coverage disappearance, ice extent along the northern route of the Northwest Passage was 9 per cent less than normal. The “rebounding” of the sea ice coverage from its record low of 2012 highlights the large interannual variability of both arctic sea ice and the global climate system.
At the beginning of the year, the Great Lakes were not looking so great. Water levels on each of the lakes were well below their long-term average. In fact, Lake Michigan-Huron was at its lowest level in recorded history. Too many warm record-dry seasons combined with year-round evaporation and half the ice cover of 30 years ago were to blame. Nature just couldn’t deliver enough runoff, rain and snow to counterbalance the moisture loss and outflows. In January, Lake Michigan-Huron dipped 1 cm below its previous record low monthly level set in March 1964. The water level was more than two metres below the lake’s record high set in October 1986 and lower than it had ever been for any month since modern record-keeping began in 1918. The lower lake levels and expanding shorelines spelled trouble for lakeside businesses, commercial shippers and the environment, and were leaving cottagers and recreational boaters high and dry. At the beginning of spring, water levels ranged from 17 cm below the 1918-2012 average in Lake Ontario to 68 cm below the long-term average for Lake Michigan-Huron, and were significantly lower than levels the same time last year. Levels and flows in connecting rivers were also lower than normal, including the St. Lawrence at Montreal where an exceptionally dry summer in 2012 resulted in record low water levels from July through September.
By summer of 2013 there was some good news – a snowy winter and a much wetter-than-normal spring resulted in water levels throughout the Great Lakes-St. Lawrence River system rising significantly. This year was one of the top five wettest in 66 years and the Great Lakes levels responded with a welcome rise. All ended the year higher than they were at the same time last year. The level of Lake Ontario was a few centimetres above its 1918-2012 long-term average, and lakes Superior, St. Clair and Erie were within 15 cm of their long-term averages. While Lake Michigan-Huron remained 40 cm below the average, wet conditions kept it well above its record low levels. By the beginning of November, all the Great Lakes had gained between 10 and 31 cm relative to the monthly average over the course of the year. Downstream, levels in the St. Lawrence River also recovered, fluctuating around average values throughout much of the spring and early summer before falling somewhat below average during the late summer. Still, they were well above the record lows experienced the previous year.
| Location | January | November | 11 Month Recovery |
|---|---|---|---|
| Superior | 34 cm below | 7 cm below | +27 cm |
| Michigan-Huron | 71 cm below | 40 cm below | +31 cm |
| St. Clair | 39 cm below | 13 cm below | +26 cm |
| Erie | 19 cm below | 1 cm below | +18 cm |
| Ontario | 21 cm below | 7 cm above | +28 cm |
- Date modified: