Top of Page
Previous page | ToC | Next page
“Comparable facilities” are those that reported GHG emissions for each year being analyzed, and the short-term trend analysis included in the present report uses facilities that reported in both 2008 and 2009. Understanding the trend from comparable facilities provides a more accurate representation of the overall trend as it removes the variability in the number of facilities reporting each year and for this year, in particular, removes the effect of the threshold reduction. For the years 2008 and 2009, there are 341 comparable facilities and their emissions account for 95% of the total emissions reported for these two years. Additional data and analysis presented herein from this point forward will focus on comparable facilities and their emissions.
Between 2008 and 2009, emissions reported by comparable facilities show a reduction of 23.6 Mt (or 9%). In comparing overall changes in emissions from 2008 to 2009 for these facilities, by industrial sector, fossil-fuel electric power generation led, with a decline in emissions of 12.7 Mt, followed by a 5.6 Mt decrease in emissions from iron and steel mills and ferro-alloy manufacturing. Emissions from non-conventional oil extraction increased by 5.5 Mt. With respect to the non-conventional oil industry, bitumen production increased by 14% and synthetic crude by about 17% in 2009, as compared to 2008, which drove emission growth in that sector7.
Overall, the industries shown in Figure 2 represent a decline of 21.6 Mt (92% of the total short-term decrease). As observed across multiple sectors, decreasing emissions from the electricity sector can be attributed to lower demand as a result of the economic recession. Combined with mild weather, lower demand for electricity in Ontario in 2009 resulted in significantly lower emissions, with coal-fired generation at its lowest output in 45 years.8 A slight increase in electrical demand was observed in Alberta and it is related to the province’s oil and gas economy.
The decrease in manufacturing emissions is primarily the result of the downturn in the economy. Nationally, manufacturing sales fell by 18%9, which is in line with the 16% decrease in emissions and subsector-specific impacts. The production of iron and steel has decreased by 8%10 globally due to the recent recession. The domestic demand for steel products by various sectors (namely the automobile industry) decreased considerably (39%). There was also a significant reduction (53%)11 in the export of steel products to the U.S. This caused Canadian production to decrease by 39% following, with more intensity, the global trend. This fact is reflected in the 33% decrease in emissions for this sector. Canada remained a net importer of iron and steel milled products.
The decrease in emissions from cement production was explained by the drop in domestic and international (mainly U.S.) demand for cement. Between 2008 and 2009, domestic cement sales and cement product exports fell by 17% and 26%12, respectively, due to the decline in construction activity in Canada and the U.S. With regard to the chemical industry, manufacturing sales were reduced by 16%, driving down the production requirements, hence lowering emissions. Finally, because of production capacity reductions at certain plants and the closure of another, a decrease in emissions was observed in the lime manufacturing sector.
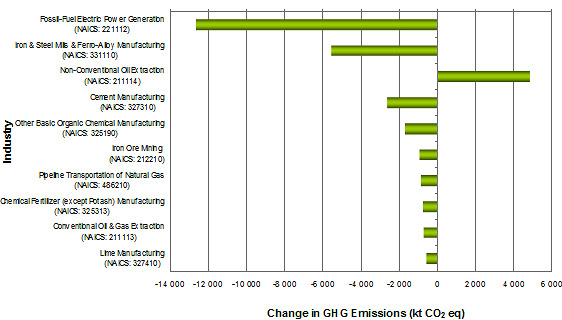
* Comparable facilities are those that reported in both 2008 and 2009
Among the provinces and territories, Alberta and Saskatchewan showed increases in reported emissions from comparable facilities, while other provinces saw a decline in reported emissions (Figure 3).
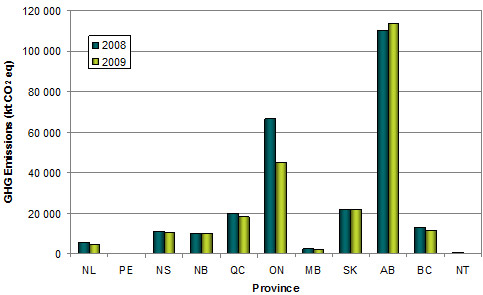
* Comparable facilities are those that reported in both 2008 and 2009
7 Energy Resources Conservation Board. 2009. Mineable Alberta Oil Sands, Annual Statistics for 2009: ST43-2009. Available online at: www.ercb.ca/docs/products/sts/st43_2009.pdf
8 Independent Electricity System Operator (IESO). “Wind Power in Ontario Generates a New Record in 2009”, January 8, 2010.
9 Source: Statistics Canada, CANSIM Table 304-0014.
10 Source: Iron and Steel Statistics Bureau (UK).
11 Source: Statistics Canada, Catalogue 41-019 December 2009.
12 Source: Statistics Canada, CANSIM Table 303-0061.