Top of Page
Previous page | ToC | Next page
Over the 2004–2009 period, the total number of facilities reporting increased from 326 in 2004 to 522 in 2009. Annual fluctuations have occurred in the number of facilities reporting over this timeframe—a result that was expected since emissions for some facilities may be below or above the reporting threshold in any given year and the number of voluntary reporters may change each year. The threshold reduction has had a particular impact this year, with an increased number of new facilities reporting at the lower threshold.
The long-term trend analysis presented in this section takes into consideration the comparable facilities from 2004 to 2009, meaning those that reported GHG emissions every year over this period. As mentioned in the previous section, analyzing comparable facilities (i.e. facilities that have reported every year) can provide a more accurate representation of the overall trend, as it removes the variability in the number of facilities reporting each year, especially given the recent change in threshold. If one focuses on comparable facilities over the long-term (2004–2009), there are 269 comparable facilities, and their emissions represent a large portion of the total emissions reported each year (over 95% from 2004 to 2008; 85% for 2009). Since 2004, the emissions from comparable facilities declined by 40.1 Mt or 15.2% (Table 4). The largest annual change in emissions for these facilities was the 11.0% decrease that occurred between 2008 and 2009.
| 2004 | 2005 | 2006 | 2007 | 2008 | 2009 | |
|---|---|---|---|---|---|---|
| Number of comparable facilities | 269 | 269 | 269 | 269 | 269 | 269 |
| Emissions (kt CO2 eq) | 262 909 | 265 320 | 258 927 | 262 989 | 250 364 | 222 853 |
| Annual change (%) | NA | 0.9% | -2.4% | 1.6% | -4.8% | -11.0% |
| Change since 2004 (%) | NA | 0.9% | -1.5% | 0.0% | -4.8% | -15.2% |
Note: NA = not applicable.
* Comparable facilities are those that reported every year between 2004 and 2009
The provincial/territorial long-term trend for comparable facilities (Figure 4) is similar to the short-term trend for most provinces and territories, in that it displays a decline in emissions. Saskatchewan had an overall decrease in emissions of 0.7 Mt over the long term. Increases in emissions were in the Mining and Oil and Gas extraction sector in Alberta (5.1 Mt) and the Utilities sector (0.3 Mt) in Saskatchewan. The decline in emissions between 2004 and 2009 in Ontario is mostly due to a drop of 14.2 Mt in the Utilities sector, followed by a drop of 14.1 Mt in the Manufacturing sector. British Columbia displayed a 3.0 Mt drop in emissions, attributable to decreases in all sectors, but mainly from the Manufacturing sector (1.5 Mt) and Mining and Oil and Gas extraction (0.9 Mt). New Brunswick emissions declined by 2.8 Mt due to a drop in emissions from the Utilities sector (2.5 Mt).
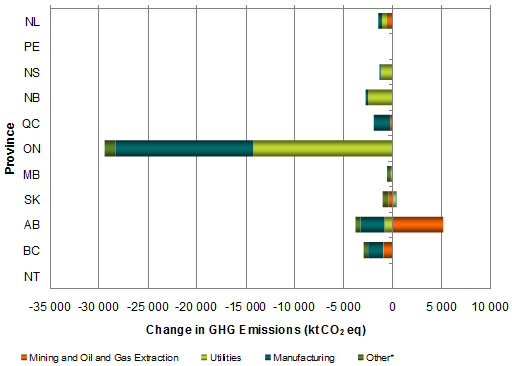
* “Other” includes Transportation and Warehousing, as well as Administrative and Support, Waste Management and Remediation Services industrial sectors
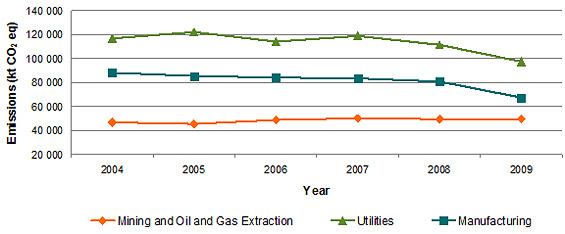
Among the three largest contributors to the long-term trend, by sector, emissions from comparable facilities in the Utilities and Manufacturing sectors have declined, while emissions from Mining, Quarrying, and Oil and Gas Extraction have slightly increased since 2004 (Figure 5). The Utilities sector exhibits significant variability that reflects the many factors affecting this sector, such as fuel costs (particularly oil and natural gas), weather, generation sources (nuclear, coal, hydro, wind) and demand by the manufacturing and residential sectors.
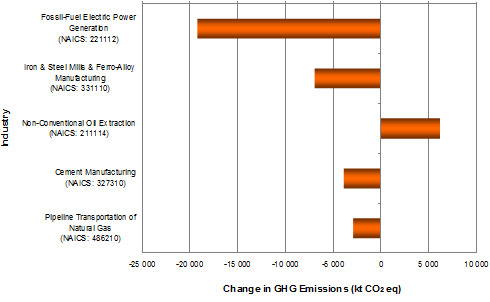
Some of the industries showing the largest change in GHG emissions are different in the short term (Figure 2) versus the long term (Figure 6). Also worth noting is the fact that the only contributor that increased in both the short term (4.8 Mt) and long term (2.8 Mt) is non-conventional oil extraction. Steady growth in that area has led to the trend. Over the 2004 to 2009 period, the amount of oil sands mined has increased by 16% while synthetic crude oil production has increased by 27%13.
One of the industries showing the largest change in emissions from 2004 to 2009 is the Utilities sector. The decrease in emissions in this sector results from a combination of hydraulic conditions, economic activity, investment in renewables and increased conservation efforts. As mentioned above, the recent decline in emissions is tied to the economic recession and mild weather. It also reflects the long-term decline in fossil-fuel electric power generation emissions in Ontario which has reduced its coal-fired capacity over the period.
Within the Manufacturing sector, a decrease in iron and steel production, which then resulted in an emission reduction, was caused by the lowering of domestic and international demand for steel products. Domestic shipments of steel products to various industries went from 11.3 Mt in 2004 to 5.6 Mt in 2009 (i.e. a drop of 50%), while exports to the U.S. fell from 3.0 Mt in 2004 to 2.2 Mt in 2009 (i.e. a decrease of 28%).14 The downward long-term emission trend for cement production, similar to the short-term trend discussed above, could be attributed to the diminution in construction activities.
13 Energy Resources Conservation Board. 2009. Mineable Alberta Oil Sands, Annual Statistics for 2009: ST43-2009. Available online at: www.ercb.ca/docs/products/sts/st43_2009.pdf
14 Source: Statistics Canada, Catalogue 41-019, December 2004 and December 2009.