Canada is the second-largest country in the world. Average and seasonal temperatures vary widely, depending on the region - most of the country experiences short, hot summers and long, extremely cold winters. Canada's population in 2005 was 32.8 million, with 80% living within 160 kilometres of the 6,400 kilometre long border with the United States - a distribution that illustrates Canada's high level of economic integration with the US and our low population density. Heating, cooling and transportation associated with the Canadian geographic context contribute to high energy demand and per capita greenhouse gas emissions.
The Canadian economy is export-oriented and resource-based - more than 40% of Canada's economic output is exported - and 40% of the exports are energy-intensive, resource-based commodities. Canada is one of only a few industrialized countries that are net exporters of coal, oil and natural gas, with large reserves of each.
More than half of the oil and natural gas produced in Canada is exported for US consumption. Between 1990 and 2002, net oil exports grew by 449% while natural gas exports grew by 138%. Other G7 countries, with the exception of the UK, increased their imports of oil and gas over the same period, thereby effectively exporting that portion of the emissions associated with the production of the fossil fuels they consume.
Fossil Fuel
As a net energy exporter, Canada bears part of the GHG emissions burden for fossil fuel consumption in other countries. In 2004, Canada's fossil fuel production sector emitted 4 tonnes per capita. If our trading partners were allocated the emissions associated with producing the fossil fuels they import from us, Canada's per capita GHG emissions from fossil fuel production would fall to just 2 tonnes per capita.
Canada's national circumstances and emissions profile are not expected to dramatically shift in the near term. Population growth is expected to continue for the next 15 years, while the Canadian economy is forecast to continue to prosper - growth is forecast at 2.4% annually for the next 15 years.
While net exports of natural gas are expected to decrease by 2020 from current levels (production of natural gas is expected to decline due to depletion of conventional gas resources, while domestic demand is projected to increase), net oil exports are forecast to increase by some 200% by 2020 over 2004 levels.
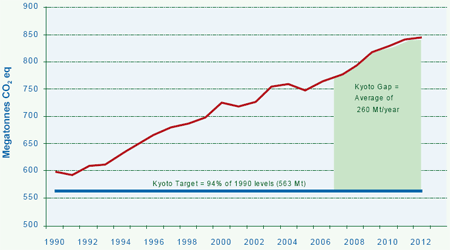
Canada's Kyoto target for the 2008-2012 commitment period is a 6% reduction in GHG emissions relative to 1990 levels. In 1990, Canada's GHG emissions were about 599 Mt CO2 eq, putting Canada's target level of GHG emissions at 563 Mt CO2 eq.3 Canada's GHG emissions have grown steadily since 1990.
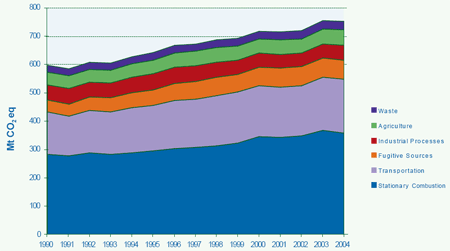
Over 80% of Canada's GHG emissions come from the production and use of energy, mostly from stationary fossil fuel combustion (47%) and transportation (25%). Industrial process emissions and agriculture each account for about 7% of Canada's total GHG emissions (Chart 4).
Chart 4: Canada's GHG Emissions by Source, 1990-2004

Source: Environment Canada, Trends in GHG Sources and Sinks in Canada, 1990-2004
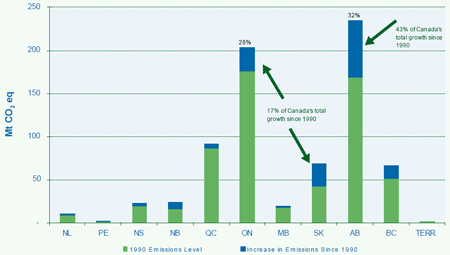
GHG emissions are not distributed evenly across Canada. Differences in factors such as climate, energy resources, industrial structure and travel patterns contribute to different levels and trends of emissions. In 2004, Alberta was the largest contributor, with 31% of Canada's total emissions (235 Mt). Ontario followed closely with about 27% of the national total (203 Mt). Quebec, Saskatchewan and British Columbia contributed 12%, 9.2% and 8.9% respectively.
Alberta accounted for 43% of total growth in emissions over the period from 1990 to 2004. Ontario and Saskatchewan each accounted for 17% (Chart 5).
Chart 5: Provincial GHG Emission Levels, 2004

Source: Environment Canada, Trends in GHG Sources and Sinks in Canada 1990-2004
With the signing of the Kyoto Protocol in 1998 and its subsequent ratification in 2002, the Government of Canada assumed an enormous challenge on behalf of Canadians. In 2000 the Government launched Action Plan 2000 on Climate Change, designed to reduce emissions of GHGs by 49 Mt CO2 eq by 2010. In 2002, following an extensive process of public consultation, the Government released the Climate Change Plan for Canada, which was intended to reduce GHG emissions by an additional 100 Mt CO2 eq by 2010. And in 2005, the Government announced Project Green, which was intended to ensure Canada's compliance with its Kyoto commitments. These initiatives included a mix of policy approaches, with a heavy reliance on voluntary measures. Despite these plans, Canada today is faced with the fact that its GHG emissions have continued to rise steadily for the past decade.
According to Natural Resources Canada's report Canada's Energy Outlook: The Reference Case 2006, emissions stood about 27% higher than 1990 levels as of 2004. In 2010, it is projected that Canada's GHG emissions will be in the neighborhood of 830 Mt CO2 eq (Chart 6).
Chart 6: Canada's GHG Emissions, Projected to 2012

Source: Natural Resources Canada, Canada's Energy Outlook: The Reference Case 2006
This means Canada's Kyoto "gap" - the level of emissions reductions required to meet our Kyoto target - will be about 260 Mt CO2 eq on average for each and every year from 2008 to 2012. This will require about a 33% annual reduction from business-as-usual levels for each of the five years of the Kyoto Protocol's first commitment period.
3 Carbon dioxide equivalent (CO2 eq) is a metric measure used to compare the emissions from various greenhouse gases based upon their global warming potential (GWP). The carbon dioxide equivalent for a gas is derived by multiplying the tonnes of the gas by the associated GWP. For example, the GWP for methane is 21, which means that emissions of 1 million metric tonnes of methane are equivalent to emissions of 21 million metric tonnes of carbon dioxide.