5.0 Analysis and Assessment
The NRTEE's 2009 analysis and assessment focuses on two methodological issues and differences in what is presented in the Plan and our preferred approach to calculating emission reductions. The first relates to the Regulatory Framework, including how emissions and emissions reductions are defined in the Plan. In this instance, the Plan accounts for compliance with the Regulatory Framework as emissions reductions even if compliance mechanisms such as contributions to the Technology Fund or credit for early action will not result in emissions reductions within the Kyoto period. The second issue relates to the relationship between the program-by-program analysis and the integrated analysis of all the measures together. Here, issues of additionality and free-ridership result in larger projected emissions reductions in the forecasts for some individual policies and programs, than in the integrated modelling forecast. Both of these issues were identified previously by the NRTEE in its 2008 Response. A detailed analysis of each program and policy is provided in Appendix A.
Definitions of Projected Emissions under the Regulatory Framework
As in previous Responses, the NRTEE notes a persistent concern in defining emissions under the Regulatory Framework, particularly with the Technology Fund. Previously, the Round Table had indicated that emission reductions attributed to the Technology Fund should be counted only when the reductions actually occur, not when compliance fees are paid into the Fund by covered entities. Virtually all of the reductions derived from technologies funded by the Fund will only occur outside the KPIA period as the technologies have not yet been financed from the Fund, since it is not yet operational. The spring 2009 CESD Report highlighted similar concerns. The CESD suggests compliance contributions by firms into the Technology Fund should only be counted once reductions occur. From the perspective of the Round Table, this should not be considered as a comment on the efficacy of the Technology Fund as an instrument to reduce emissions; rather, only on the accounting of actual versus forecast emission reductions flowing from it. The government is aware of this difference in approach, formally disagreeing with it in its response to the CESD's report. For purposes of clarity, that response is quoted below:
"The Regulatory Framework provides a number of options to industry for meeting these obligations. Environment Canada's modelling indicates that the choice of compliance option is influenced by differences in marginal costs that they present to regulated industries and therefore, actual in-year reductions may vary from the plan's estimates, depending on the specific compliance options chosen by individual firms. Because the Framework is market-based, it is not possible to establish with certainty which options will be most used by industry, and any such estimate would be so heavily dependent on a variety of technical assumptions that it would be inappropriate for use for the purpose of compliance with the Kyoto Protocol Implementation Act."[11]
While the government's view is that as contributions made now to the Technology Fund under the Regulatory Framework will in fact lead to emission reductions in the future — so they should be accounted for in the present — a conclusion from the NRTEE's evaluation is that accounting for potential future emissions reductions as actual realized reductions will result in a likely overestimate of emissions reductions within the KPIA period, which is the focus of the Act and the object of the analysis conducted. The NRTEE believes the Regulatory Framework will result in emission reductions. Our issue is the time frame in which these should properly be accounted.
Building on the issues raised in its analysis of the Regulatory Framework in its 2008 Response, the NRTEE also sees a continuing underlying issue with the Framework: the definition of emissions and emission reductions. As part of its responsibility for GHG emissions monitoring, accounting, and reporting, Environment Canada maintains Canada's GHG Inventory "which contains GHG emissions data at the national, provincial and sectoral levels and is submitted to the United Nations Framework Convention on Climate Change (UNFCCC) annually. This is the source to be used for all-inclusive national and provincial totals."[12] The inventory tracks the GHG emissions that were produced in Canada in a given year. Figure 2 shows Canada's official emissions inventory.
Figure 2: Canada's GHG Emissions Inventory, 1990-2007 (Source: Environment Canada) [13]
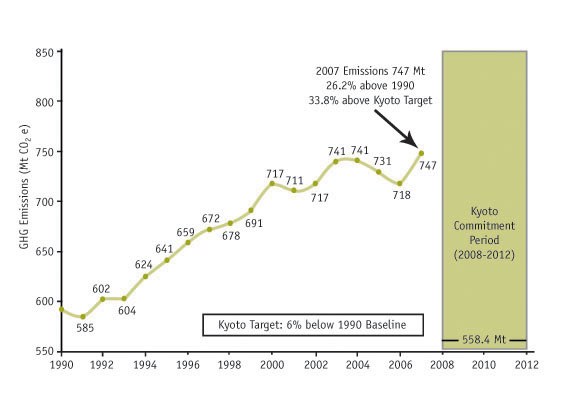
However, the definition of emissions used in the forecasts provided in the Plan is not the same as the definition of emissions used by Environment Canada for emissions inventories for purposes of the UNFCC. The Plan presents forecasts of what the government has previously defined as Regulatory Emissions.[14] These KPIA regulatory emissions are emissions net of compliance activities that firms undertake in response to the policies and programs under the Regulatory Framework policy. However, as noted above, compliance activities include actions that do not reduce actual emissions in the KPIA time period — specifically contributions to a Technology Fund and credits for previous emissions-reducing actions (early action). While these compliance activities will satisfy the regulation, they will not necessarily result in decreased emissions in the time frame that would ultimately be recognized in the inventory.[15] Similarly, the Plan includes in its definition of emissions reductions any compliance activity under the Regulatory Framework.[16] Regardless of whether these reductions are defined relative to 1990, relative to 2006, or relative to business as usual, this methodological approach will result in a likely overestimate of the actual reduction in inventoried GHG emissions that will occur as a result of the policies. The KPIA forecast in the Plan entitled Expected Emissions Including Government Measures does not therefore reflect a best estimate of what future emissions inventories will show with the policies in place because of this difference in definition and methodology. In this case, a different metric is being forecast than what is being measured.
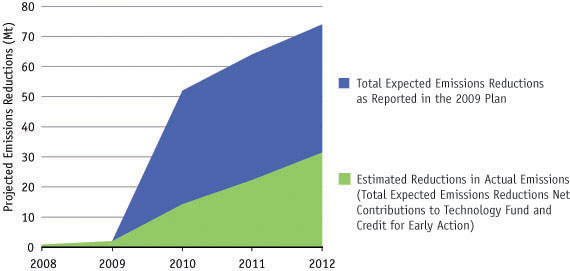
Figure 3, below, illustrates the above point. It compares regulatory compliance through payments under the Technology Fund and other measures to actual physical emissions reductions. If regulatory compliance is used as a definition for projections of future emissions, then projected emission reductions would be larger and forecasts would be overestimated.
Figure 3: Total Expected Emissions Reductions and Estimated Actual Reductions [17]
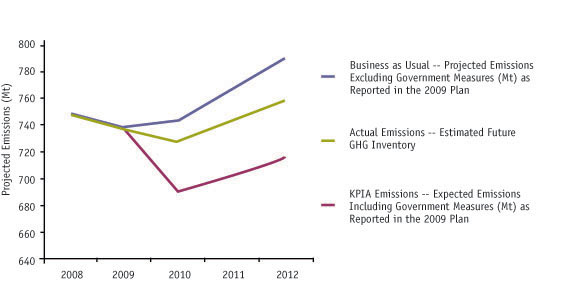
This definitional issue has an effect on the overall Kyoto Protocol targets. The Plan states: "Given the reductions anticipated from the measures in this Plan, Canada expects to be 802 Mt above its Kyoto Protocol target of 2,792 Mt during the 2008 to 2012 period."[18] A reader would interpret this to mean that Canada's emissions inventory will average 718.8 Mt/year (2792 Mt target + 802 over the target =3594 Mt over 5 years). Analysis provided below, using the government's assumptions suggests Canada's emissions inventories will likely be closer to 743 Mt per year as shown in Figure 4, and the Kyoto gap would therefore be 926 Mt.[19] As emissions inventories — the actual emissions — are compiled and released each year, it will facilitate comparisons between forecasts as set out in the KPIA and results as set out in previous year inventories. This comparison will in turn facilitate discussion on the effectiveness of policies and consideration of more or different approaches, something beyond the scope of the KPIA and the NRTEE's role under it. Importantly, no final conclusion on to what extent Canada will exceed its Kyoto obligations can be determined until after 2012 when a formal accounting is done as set out within the Protocol itself.
Figure 4: Estimated Future Emissions Inventories and Trajectories Reported in the 2009 Plan
Relationship between the integrated and program-by-program analyses
The second methodological issue deals with consistency between the projections of emission reductions from individual policies and programs and the integrated modelling of the full suite of programs. Following a previous NRTEE recommendation in 2007, subsequent plans have incorporated integrated modelling to account for the policy interaction effects among measures without which there would be some double-counting of emission reductions, or additionality. The Plan does, therefore, provide a realistic estimation of emission reductions under the integrated modelling. It also sets out an aggregate number that is the sum of the emission reductions attributed to each of the individual policies and programs. This would appear to lead to more total reductions than the bottom-line number reported using an integrated modelling approach.
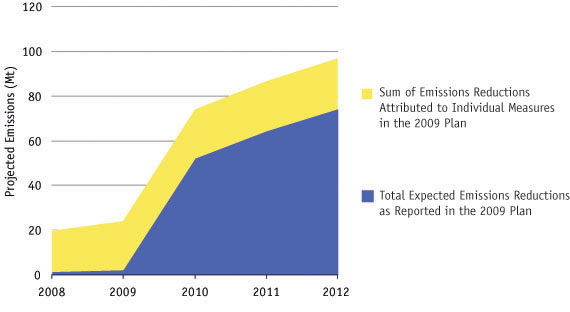
Figure 5 illustrates the difference between the two sets of emissions reduction projections based on a comparison of the two approaches. For example, the government projects, through integrated modelling, that all 19 of the programs and policies in the Plan combined will result in about 1 Mt of emissions reductions in 2009. However, adding up the reductions attributed to each individual program and the CACC Trust suggests approximately 24 Mt of emissions reductions for 2009 are attributed to the same set of measures (as illustrated in Table 3 in Appendix A).
Similar to its 2007 and 2008 Responses, NRTEE analysis suggests that some of this discrepancy between the integrated modelling and the program-by-program analysis is unavoidable due to policy interaction effects. As noted by the NRTEE in previous Responses, a methodological approach that addresses this discrepancy, as well as previously identified concerns by the NRTEE over free-ridership, other additionality issues and rebound effects within each of the individual measures, should be utilized.
Figure 5: Total Emissions Reductions Attributed to Measures in the Plan, and the Emissions Reductions of the Measures Projected Using Integrated Modelling [20]
Examples of Additionality Concerns about additionality arise where policy-level evaluations account for more than the incremental emissions reductions they generate. In the 2009 Plan, additionality concerns arise in two principal forms. First, incentive programs such as the ecoENERGY for Renewable Power and the ecoENERGY Retrofit initiative include all emissions reductions associated with financed projects rather than just those emissions reductions actually induced by the incentives. This issue is known as the free-rider effect, where program effects may be overestimated if at least some portion of the projects financed under any incentive program likely would have occurred absent the incentive. The second source of additionality concerns is found in the evaluation of information and voluntary programs. For example, under the ecoFREIGHT program, Canadian transporters have signed a Memorandum of Understanding in which they agree to undertake measures necessary to meet US legislation. Some of these reductions would likely have happened absent any action on behalf of the Canadian government; for example, freight transporters who operate in the US would likely decide to meet US legislation regardless of Canadian government actions. Additionality results from an assumption that none of the actions that result in consumers buying energy efficient products, renovating their houses, or which result in firms changing their business practices would have occurred without the contribution of the federal government's climate policies. These assumptions lead to a likely overestimate of the impact of these policies. |
When policies are tested in Environment Canada's E3MC model, reductions are derived through forecasts of the economy with and without the policies in place. As such, the baseline is very clear, and only incremental reductions due to the policies will be counted.[21] The issue thus exists in the individual program-by-program projections prior to being run through the integrated modelling. The greater the additionality concerns at the individual measure level, the greater the gap will be between the integrated estimates provided on page 30 of the Plan and the sum of the individual actions found throughout the Plan.
Examples of Rebound As in previous year's Plans, reductions attributed to regulatory changes do not fully account for induced increases in usage intensity (the rebound effect) as suggested in the NRTEE 2007 and 2008 Responses. As new technology becomes cheaper to use with increases in efficiency, empirical evidence consistently confirms that increases in use erode some of the reductions in emissions. While the rebound effect is properly accounted for both in the integrated modelling and in policy-level analysis of certain programs (the ecoENERGY for Vehicles Program), it is not accounted for in others, which leads to a likely overestimation of induced emissions reductions. Since program-level estimates for the ecoENERGY Retrofit Initiative and Energy Efficiency Regulations do not account for rebound effects, but these are accounted for in the integrated modelling, the gap between the integrated estimates provided on page 30 of the Plan and the sum of the individual actions found throughout the Plan is larger than it should be. |
Only an integrated forecast that imposes all of the policies simultaneously can account for policy interaction effects, which is why such an approach was recommended by the NRTEE in its 2007 Response and adopted by the government in their 2008 and 2009 Plans. Note, however, that even if the issues of additionality and rebound effects were fully corrected, and the assumptions with respect to impacts were the same in the program-level and integrated modelling, the individual estimates should not be expected to sum up to the total reductions, as policy interaction effects would also result in differences between the forecasts.
There are two practical ways to assess the contribution of an individual program — either determine how much the program would (on its own) reduce emissions from the business as usual emission pathway ignoring all other programs; or consider how much actual emissions would increase if only that program was removed, leaving all other programs in place. Either of these measures captures a type of marginal or incremental contribution of the program.[22] In the 2008 NRTEE Response, the second method of calculating impacts was advanced. The NRTEE recommended that Environment Canada report incremental contributions of each individual policy by successively removing each policy leaving all others in place in the model, and comparing the resulting emissions to the business as usual forecast. This would lead to more accurate forecasting in terms of attributing specific emission reductions to specific measures and avoid confusion.
<< Previous page | TOC | Next page >>
________________________________
12 http://www.ec.gc.ca/pdb/ghg/ghg_home_e.cfm, accessed July 8, 2009
13 Canada, 2008f. http://www.ec.gc.ca/pdb/ghg/inventory_report/2007/som-sum_eng.cfm
14 In the 2008 Plan these projections were called Regulatory Emissions. In the 2009 Plan, they are called Expected Emissions Including Government Measures.
15 See Appendix A for detailed evaluation of the projected emissions for the Regulatory Framework.
16 The Plan estimates Expected Emissions Reductions as the difference between the KPIA regulatory emissions and the business as usual emissions. Since the KPIA regulatory emissions include all compliance activities, the Expected Emissions Reductions include Technology Fund compliance and credits for previous reductions.
17 Estimates in this figure are based on analysis provided by Environment Canada.
19 This calculation assumes that 32.6, 36.6, and 37.7 Mt of actual emissions will be offset in regulatory terms by contributions to the Technology Fund in 2010, 2011, and 2012 respectively and that 15 Mt of credits for early action will be allocated and used to offset 15 Mt of actual emissions during the same period. The Actual Emissions trend in Figure 4 is therefore calculated as the KPIA emissions trend less the estimated regulatory compliance through Technology Fund contributions and credits for early action. This assessment is based on the Environment Canada assumption — as described in the Detailed Emissions and Economic Modelling Report (2008b) — that the Technology Fund will represent the cheapest option for firms to comply with the requirements of the Regulatory Framework for Air Emissions. While uncertainty does exist as to the actual compliance choice chosen by emitters, these numbers are consistent with analysis provided in meetings with Environment Canada.
20 Estimates in this figure are based on analysis provided by Environment Canada
21 As indicated in the NRTEE's 2008 response, the use of integrated modelling is an important improvement from the first KPIA Plan in 2007.
22 Consider the following example. If there are two programs in place, we can either evaluate the first assuming that the second is also in place or not. Equivalently, we could evaluate the changes in emissions of removing the second program, assuming that the first remained in place, or assuming that it had already been removed.