Equation 2
To achieve certification, an installed CEM system must meet all of the performance specifications outlined in Table 3. The specifications are relevant to the measurement of CO2 or O2, as well as stack gas moisture (if applicable) and stack gas flow measurement and the overall CEM system. It is acceptable for a system to be partially certified (e.g. for flow) and then fully certified at a later date when deficiencies in specific portions of the system have been corrected.
Table 3 Certification Performance Specifications
The specifications are described in Section 5.1. The gases used during certification testing are described in Section 5.2, while the applicable test procedures are outlined in Section 5.3.
After the CEM system has been installed according to the manufacturer’s written instructions, it must be operated for a conditioning period of not less than 168 hours, prior to the operational test period (OTP), during which the EGU must be operating. During the conditioning period, the entire CEM system must operate normally with the exception of periods during which calibration procedures are being carried out as well as other procedures indicated in the CEM system QA/QC manual.
The OTP is a 168-hour cumulative time period during which most of the performance specification tests are carried out. The 168-hour period may be contiguous or fragmented in periods of no less than 24 hours. No unscheduled maintenance, repairs, or adjustments to the CEM system are allowed during the OTP. The procedures in the CEM system QA/QC manual must be followed as if the CEM system were generating emissions data.
CEM systems installed at peaking EGUs are exempted from the OTP and calibration drift tests.
The calibration drift specification is applicable at the levels indicated in Table 3 and for each gas analyzer. Table 3 also includes flow monitoring calibration drift specifications.
For the gas analyzers, this procedure tests both linearity and calibration drift.
At 24-hour intervals over the 168-hour OTP, the CEM system's response to calibration gases, as indicated by the data acquisition system, must not deviate from the certified value of the appropriate gas by an amount exceeding:
Gas Analyzer
Low level: 0.5% CO2 (or O2)
Mid level: 0.5% CO2 (or O2)
High level: 0.5% CO2 (or O2)
At 24-hour intervals over the 168-hour OTP, the CEM system response to the stack gas flow, as indicated by the data acquisition system, must not deviate from the internal reference value by an amount exceeding the greater of:
Flow monitor
Low level: 3.0% of the FS setting or 0.6 m/s, absolute difference
High level: 3.0% of the FS setting or 0.6 m/s, absolute difference
The electronic drift of stack gas flow monitors that do not perform daily flow system calibration checks must not deviate from the value of the electric input signal by more than 3.0% FS.
Calibration drift must be tested according to the procedures set out in Section 5.3.2.
Further details on the use of stack gas moisture monitoring systems are presented in Section 7.
For CEM systems using dedicated analyzers, the system response time is acceptable if the average of three increasing and three decreasing values is no greater than 200 seconds, for a 90% response to a step change in concentration of gas at the probe exit. Note that this includes the lag time.
For time-shared systems, the system response time is acceptable if the average of three increasing and three decreasing values is no greater than 15 minutes, for each analyzer on each stream, for a 90% response to a step change in concentration of gas at the probe exit. Note that this includes the lag time.
System response time must be tested according to the procedures set out in Section 5.3.3.
The relative accuracy for a CO2 (or O2) gas analyzer must not exceed 10.0% or 0.5% CO2 (or O2) average absolute difference (|d|), whichever is greater.
The relative accuracy for a stack gas flow monitor must not exceed 10.0% or 0.6 m/s average absolute difference (|d|), whichever is greater, for the three levels tested.
The relative accuracy for a stack gas moisture monitor must not exceed 10.0% or 2.0% of (100 - Bws), whichever is greater, for the three levels tested.
The relative accuracy for CO2 mass emissions must not exceed 10.0%.
Relative accuracy must be tested according to the procedures set out in Section 5.3.4.
Further details on the use of stack gas moisture monitoring systems are presented in Section 7.
The bias for a CO2 (or O2) gas analyzer must not exceed 5.0% of the full scale (FS) value or 0.5% CO2 (or O2) average absolute difference, whichever is greater.
The bias for a stack gas moisture monitor must not exceed 5.0% of the FS value or 1.0% (100 - Bws) average absolute difference, whichever is greater.
The bias for a stack gas flow monitor must not exceed 5.0% of the FS value or 0.6 m/s average absolute difference, whichever is greater.
Bias must be tested according to the calculations in Section 5.3.5.
Further details on the use of stack gas moisture monitoring systems are presented in Section 7.
If there is any bias, as defined in Section 5.3.5, either positive or negative, in any measurements made by the CEM system, then the data that are subsequently generated must be corrected according to Section 5.3.5 for the bias before any subsequent use is made of the data.
The gases used by both the CEM system and the RM during the relative accuracy test must be U.S. Environmental Protection Agency (EPA) protocol grade.
Gases used during the calibration drift and response time tests must be certified to an accuracy of 2.0% by the supplier, but protocol gases may be used if desired.
The CEM system's QA/QC manual must specify a method of cross-referencing successive gas cylinders to detect out-of-specification cylinders before the new cylinders are used to calibrate the CEM system.
During the OTP, the CEM system must continue to analyze flue gases without interruption and produce a record of the emissions data using the data acquisition system. This record must be kept for the time period indicated in Section 8. Sampling may be interrupted during this test period only to carry out system instrument calibration checks and specified procedures contained in the QA/QC manual.
During this period, no unscheduled maintenance, repairs, or adjustments to the CEM system may be carried out; otherwise, the OTP must be restarted. Calibration adjustments may be performed at 24-hour intervals or more frequently if specified by the manufacturer and stated in the QA/QC manual. Automatic zero and calibration adjustments made without operator intervention may be carried out at any time, but these adjustments must be documented by the data acquisition system.
If the test period is fragmented due to EGU shutdown, the times and dates of this period must be recorded and the test continued when the EGU resumes operation. If the test is interrupted due to CEM system failure, the entire test period must be restarted after the problem has been rectified.
The performance specification tests outlined in sections 5.3.2 to 5.3.5 must be carried out during the OTP, with the exception of the relative accuracy test (Section 5.3.4), which may either be conducted during the OTP or during the 168-hour period immediately following the OTP. It is acceptable for the calibration drift tests to be completed before attempting the relative accuracy tests, to minimize the risk associated with repeating the latter.
It is acceptable for the calibration drift test period to be fragmented into sub-periods of no less than 24 hours each.
The calibration drift must be determined for the gas analyzers, and stack gas flow monitor at approximately 24-hour intervals over the course of the 168-hour test period.
The procedures to be followed during this test are listed hereunder.
5.3.2.1 Calibration Adjustments Automatic or manual calibration adjustments must be carried out each day. The calibration drift test must be conducted immediately before any such adjustments or in such a manner that the magnitude of the drifts can be determined. Since the test is carried out before adjustments, the magnitude of any drift occurring in the system or analyzer over the 24-hour period is incorporated into the reported result.
5.3.2.2 Test Procedures The performance of preliminary runs is recommended (e.g. to determine the need to use Bias Adjustment Factors) but is not mandatory.
On the first day of the performance test period, the calibration of the system must be checked by injecting the three calibration gases (Section 5.2) at the primary CEM system calibration port, as indicated in Section 3.1.1.
The system must be challenged three times per day with each of the low-, mid- and high-level calibration gases for CO2 or O2 for a total of nine tests (as described in Table 3). The series of tests must be carried out at approximately 24-hour intervals. The three ranges for each gas must not be introduced in succession or in the same sequence, but must be alternated with other gases. The response of the system, as indicated by the data acquisition system, must be recorded, and the average system response of the three calibration checks for that day must be calculated.
If the CEM system is fitted with a stack gas flow monitor, then low- and high- flow calibration check measurements must be performed once daily at approximately 24-hour intervals. The response of the system, as indicated by the data acquisition system, must be recorded, and the system response to the three calibration checks for that day must be calculated.
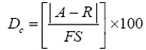
5.3.2.3 Gas Concentration Calculations The gas calibration drift for the responses to the low-, mid- and high-level test gases is calculated using Equation 2.
where:
Dc = concentration calibration drift, in %
A = average of the three system responses to the low-, mid- or high-level calibration gas, in %
R = certified concentration of the low-, mid- or high-level test gas, in %
FS = full-scale setting of the analyzer, in %
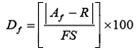
5.3.2.4 Gas Flow Calculations The flow measurement calibration drift is calculated using Equation 3.
where:
Df = flow calibration drift, in %
Af = average low or high gas velocity or flow rate, as measured by the CEM system, in m/s or m3/s
R = average low or high nominal reference gas velocity or flow rate, in m/s or m3/s
FS = full-scale setting of the flow monitor, in m/s or m3/s
Note: the RM and CEM system must have a common averaging period.
5.3.2.5 Acceptance Criteria for Certification The calibration drift test results must respect the performance specifications presented in Section 5.1.2.
This test is performed on the overall CEM system and on each gas analyzed, with the results expressed in concentration units. The test is carried out with the CEM system fully operational. Sample flow rates, pressures, and other parameters must be at the nominal values specified in the manufacturer's written instructions and must be outlined in the CEM system's QA/QC manual.
5.3.3.1 Test Procedures Low- and high-level calibration gases must be introduced alternatively at the system calibration gas injection port specified in Section 3.1.1. Sufficient time must be allowed for the system to stabilize, after which the responses of the data acquisition system to these gases must be recorded. This sequence must be carried out three times, thus generating a total of three increasing and three decreasing concentration changes. When a time-shared system is being tested, injection of the calibration gases must be timed to produce the longest possible response time for the system.
5.3.3.2 Calculations Using the output of the data acquisition system, the time required for the system to achieve a 90% response to the concentration difference between the low and high-level gases for both increasing and decreasing gas concentrations must be determined. The lag time of extractive systems (i.e. the time necessary to convey the gas sample through the sampling line) must be included when determining the time required by the system to reach a 90% response change.
5.3.3.3 Acceptance Criteria for Certification The system response time test results must meet the performance specifications presented in Section 5.1.3.
This test is a comparative evaluation of CEM system performance using the RMs found in Section 5.3.4.3.
The EGU must be operating at normal capacity or at greater than 50% maximum heat input while combusting the primary fuel normal for that unit. New EGUs or ones that did not operate in the previous two quarters must be operating at greater than 50% maximum heat input. The CEM system must be operated in a routine manner during this test, and no adjustments, repairs, or modifications to any portion of the system may be carried out other than those actions outlined in the QA/QC manual. As the system includes the hardware and software associated with data acquisition, data manipulation and system control, parameters in this subsystem must not be modified during the test.
5.3.4.1 Reference Method Sampling Point for Non-stratified Flow Where it has been demonstrated, using the procedures outlined in Section 4.2.1, that the flue gases are not stratified, the RM testing may be carried out at a single test point in the flue or duct, with the gas extraction point being no closer than 7.5 cm from any wall.
When certifying extractive or in situ point systems, the RM probe tip must be located no closer than 30 cm from the CEM probe. For in situ path systems, the RM probe must be no closer than 30 cm from the inner 50% of the measurement path. The RM probe must be positioned so that it will not interfere with the operation of the CEM system being tested.
5.3.4.2 Location of Reference Method Sampling Points in Presence of Stratified Flow If the gas flow has been found to be stratified using the procedures outlined in Section 4.2.1 or if the stratification test has not been performed, the RM sample must be collected at several points in the gas flow.
A "measurement line" that passes through the centroids of the flue or duct must be established.
This line must be located within 30 cm of the CEM sampling system cross-section. Three sampling points must be located at 16.7, 50, and 83.3% along the length of the measurement line. Other sampling points may be selected if it can be demonstrated that they will provide a representative sample of the bulk gas flow during the test period.
5.3.4.3 Test Methods U.S. EPA Method 3A must be used for measuring CO2 or O2 concentration. Environment Canada EPS 1/RM/8 must be used for stack gas flow and moisture measurement unless multi-dimensional stack gas velocity is present or when measuring velocities near the stack gas wall. When multi-dimensional stack gas velocity is confirmed in the stack, U.S. EPA Methods 2F and 2G must be used. When measuring velocities near the stack wall, U.S. EPA Conditional Test Method CTM-041 and U.S. EPA Method 2H must be used.
5.3.4.4 Sampling Strategy A minimum of nine comparisons of the RM and CEM results must be conducted to evaluate the performance of the CO2 CEM system being tested. When manual sampling RMs are being used, the sampling must be carried out at a fixed sampling rate; that is, the sampling rate must not be adjusted over the duration of the test, except to maintain the flow at the initial rate. Sampling must be carried out for 30 minutes during each test, divided equally over the three sampling points for stratified flow testing or at the single point for non-stratified flow.
The operator may choose to carry out more than nine sets of comparisons. If this option is exercised, then the results of a maximum of three tests may be rejected from the test data if an appropriate statistical test applied to the data demonstrates that these results are outliers. A minimum of nine RM tests must be available after the statistical rejection of data. All data must be reported, including the outliers, along with all calculations.
All appropriate gas and moisture measurements must be conducted simultaneously with the RM pollutant concentration measurements.
If the CEM is fitted with both a stack gas flow and a moisture monitor, then RM concentration measurements must be concurrent with RM flow measurements. Two additional sets of nine flow and moisture comparisons must be carried out either during the OTP or during the 168-hour period immediately following the OTP, so as to complete a set of flow and moisture measurements for the minimum safe and stable load, mid-load and high-load levels.
Flow monitors installed at peaking EGUs and bypass stacks may perform flow and moisture comparisons at a single load level.
5.3.4.5 Correlating Reference Method and CEM System Measurements In order to correlate the data from the CEM system and RM tests, the beginning and end of each test period must be clearly marked on the CEM data acquisition record and the CEM time must be synchronized with the RM test crew time. After each test is completed, the results from the CEM system must be compared with the data derived from the RM results over the exact time period during which the test was performed.
The CEM system and RM results must be correlated on the same basis. Thus, corrections must be applied for moisture, temperature, pressure, etc. The auxiliary measurements of the RM testing (such as stack gas moisture or barometric pressure) are used to make any adjustments to the RM results. The auxiliary measurements of the CEM system are used to make adjustments to the CEM results.
5.3.4.6 Calculations The relative accuracy of the system must be calculated for each gas measured by the system in terms of concentration in percent (by volume), as well as stack gas flow in terms of m/s or Sm3/h.
(i) Calculation of relative accuracy
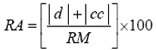
The relative accuracy is calculated using Equation 4.
Equation 4
where:
RA = relative accuracy, in %
d = mean difference between the CEM system and RM results
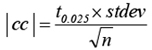
cc = confidence coefficient
RM = average of the reference method results
(ii) Calculation of differences
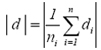
The absolute value of the difference between the CEM system and RM results is calculated using Equation 5.
Equation 5
where:
di = difference between an RM value and a corresponding CEM system value (di = CEMi - RMi) for the ith test run
n = number of data pairs
Note: The numeric signs for each data pair must be retained. The absolute value of the sum of
differences is used, not the sum of absolute values of the differences.
(iii) Calculation of confidence coefficient and standard deviation
The values of the confidence coefficient and standard deviation are determined from equations 6 and 7, respectively.
Equation 6
where:
cc = confidence coefficient
t0.025 = t value from Table 4 for a one-tailed t-test corresponding to the probability that a measured value will be biased low at a 95% level of confidence
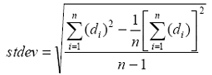
stdev = sample standard deviation of the differences of the data pairs from the relative accuracy test, calculated using Equation 7
n = number of data pairs
Equation 7
where parameters are as defined above.
| n-1 | 5 | 6 | 7 | 8 | 9 | 10 | 11 | 12 | 13 | 14 |
|---|---|---|---|---|---|---|---|---|---|---|
| t0.025 | 2.571 | 2.447 | 2.365 | 2.306 | 2.262 | 2.228 | 2.201 | 2.179 | 2.160 | 2.145 |
Note: These are t values for one-tailed t-test at a 95% confidence level.
(iv) Calculation of reference flow-to-output and heat-to-output ratios
If the CEM system includes a stack gas flow monitor, the flow-to-output or heat-to-output ratio is to be used as reference for the quarterly stack gas flow test in subsequent quarters.
Depending on the option chosen for the quarterly stack gas flow test, as described in Section 6.3.2, one or more of the following averages must be calculated, based on the process data and the RM measurements obtained during the relative accuracy test of the initial CEM certification or subsequent relative accuracy test audit (RATA):
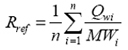
The flow-to-output ratio is calculated from the results of the RM runs, using Equation 8.
Equation 8
where:
Rref = reference value of flow-to-electric-output ratio on a wet basis, from the most recent RATA, in WSm3/MWh
Qwi = flow measured during each test run on a wet basis, in WSm3/h
MWi = mean gross electric output during each test run, in MW
n = number of data pairs
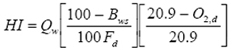
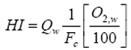
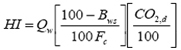
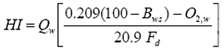
The heat input is the average of the gross heat input during each RATA test run. It must be calculated on the basis of the measured stack gas flow and F-factors (as shown in Table A-1). The heat input corresponding to a RATA test run must be calculated with one of equations 9, 10, 11 and 12.
Equation 9
where the following values represent test run averages:
HI = heat input, in MJ/h
Qw = stack gas flow on a wet basis, in WSm3/h
Bws = moisture content of the stack gas, in %
Fd = fuel-specific F-factor from Table A-1 or calculated as per Appendix A
Fc = fuel-specific F-factor from Table A-1 or calculated as per Appendix A
O2,w = stack gas oxygen concentration, in % on a wet basis
CO2,d = stack gas carbon dioxide concentration, in % on a dry basis
O2,d = stack gas oxygen concentration, in % on a dry basis
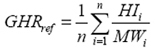
The reference heat-to-electric-output ratio (or gross heat rate) is calculated with Equation 13, from the results of the RM runs.
where the following values are RM test run averages:
GHRref = reference value of gross heat rate, from the most recent RATA, in MJ/MWh
HIi = gross heat input during each test run, in MJ/h
MWi = mean gross electric output during each test run, in MW
n = number of data pairs
5.3.4.7 Acceptance Criteria for Certification The performance specifications presented in Section 5.1.4 must be respected.
A bias or systematic error is considered to be present if, in the measurements of CO2 (or O2), moisture or stack gas flow the:
As presented in Section 5.1.5, acceptable bias is
(|d| - |cc|) ≤ 5.0% FS
or
|d| ≤ 0.5% CO2 (or O2) for CO2 or O2 analyzers
or
|d| ≤ 0.6 m/s for stack gas flow monitor
or
|d| ≤1% of (1 - Bws) for stack gas moisture analyzer
If bias is present, as determined by Equation 14, and it is within the above levels, then the subsequent measurements of the CEM system must be corrected by a bias adjustment factor (BAF), using equations
15 and 16.
where:
CEMadjusted = data adjusted for bias
CEMmonitor = data provided by the monitor
BAF = bias adjustment factor, defined by Equation 16
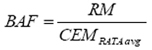
Equation 16
where:
BAF = bias adjustment factor
CEMRATA avg = average CEM results during RATA
RM = average of the reference method results
The use of a BAF in any measurement must be stated in the QA/QC manual.
5.3.5.1 Acceptance Criteria for Certification The performance specifications presented in Section 5.1.5 must be respected.