This section provides detailed descriptions of the step-by-step procedures required to operate and evaluate the system, including details about daily, quarterly, semi-annual and annual performance evaluations. Procedures and minimum criteria for a selection of these activities are provided in sections 6.2 to 6.5. A summary of these performance evaluations is outlined in Table 5.
Table 5 Daily, Quarterly, Semi-annual, and Annual Performance Evaluations Summary
A QA/QC manual must be developed for each installed CEM system and updated, as needed, to reflect any changes in the system or the procedures. The QA/QC manual must describe the complete program of activities to be implemented to ensure that the data generated by the CEM system will be complete, accurate, and precise. The QA/QC manual must contain, as a minimum, the elements found in Table B-1 of Appendix B.
Calibration of the CEM system is one of the most important aspects of a QA/QC program. The following summarizes the requirements for calibration drift, all of which must appear in the CEM system's QA/QC manual.
6.2.1.1 Frequency The drift of each gas analyzer and flow monitor must be determined at least once daily, at 24-hour intervals. It is good practice to determine the drift of each analyzer even during periods when the EGU is down. The operator may, however, skip the daily calibration during periods lasting more than a day in which the EGU burns no fuel. However the CEM system must be successfully calibrated prior to or during start-up to avoid using the backfilling option (Section 3.5.2).
6.2.1.2 Test Gases Protocol gases or gases certified to an accuracy of 2.0% must be used for the daily calibration of gas analyzers.
6.2.1.3 Calibration Gas Injection Port The location of the applicable calibration gas injection port for each type of CEM system are shown in Table 2 of Section 3.1.1 Calibration checks must be carried out under the same system operating conditions as those used during monitoring (e.g., pressure, flow, temperature, etc.). For path-type analyzers that do not accept flowing gases, a sealed cell containing a known concentration of gas can be used for calibration checks.
6.2.1.4 Test Procedures Two concentration/flow calibration levels must be used: low level (0–20% FS) and high level (80–100% FS).
A calibration adjustment for the low-level gas must not be made before checking both the low- and high-level gases. If a multi-range instrument is used with a system that automatically selects the range, the drift of each range must be checked daily.
The gas analyzer must attain a steady output before use, as indicated by the data acquisition system.
Calibration drift must be tested according to the procedures set out in Section 5.3.2.
Further details on the use of stack gas moisture monitoring systems are presented in Section 7.
6.2.1.5 Adjustment of Analyzers/Monitors Gas analyzers and flow monitors must be adjusted whenever the daily low- or high-level calibration drift exceeds the following specifications:
Gas analyzer
Low level: 0.5% CO2 (or O2)
High level: 0.5% CO2 (or O2)
Flow monitor
Low level: 3.0% of the FS setting or 0.6 m/s absolute difference, whichever is greater
High level: 3.0% of the FS setting or 0.6 m/s absolute difference, whichever is greater
Stack gas moisture monitor (wet O2 system)
Low level: 0.5% O2 (24 hours)
High level: 0.5% O2 (24 hours)
6.2.1.6 Out-of-Control Period An out-of-control period occurs when either the low- or high-level calibration drift of a gas analyzer, flow monitor or stack gas moisture monitor exceeds twice the applicable drift specification, as indicated in Section 6.2.1.5. This period begins the minute of the calibration drift check and ends the minute after corrective action has been taken and the system has demonstrated that it is operating satisfactorily. When a gas analyzer, flow monitor, or stack gas moisture monitor is out-of-control, the data generated by the specific component are considered missing and do not qualify for meeting the requirement for system availability. Missing data must be backfilled using the criteria provided in Section 3.5.2.
6.2.1.7 Tabulation of Data All calibration drift data must be recorded and tabulated by day, month, and hour, with the magnitude of the drifts in percent for gas analyzers, and flow-related levels for flow monitors. These data must be summarized on a quality control chart.
6.2.1.8 Quantification of Drifts When the data acquisition subsystem automatically compensates data for drifts, the system must be capable of also storing unadjusted concentrations of the calibration gases, unadjusted flow levels, and the magnitude of all adjustments. If strip chart recorder data are reported, any automatic calibration adjustment must be noted on the strip chart record.
For a CEM system that physically resets the analyzer automatically, the data acquisition system must store the unadjusted concentrations in addition to the magnitude of the adjustment.
The electronic drift of flow monitors that do not perform daily system calibration checks must not deviate from the reference electric input value by more than 3.0% FS equivalent.
During each quarter, a cylinder gas test and one of the options for a stack gas flow test must be performed on the CEM system. Special provisions apply to peaking EGUs and to path-type analyzers that do not have the capability of accepting a flowing calibration gas. Hereunder are the requirements for these tests, all of which must appear in the CEM system's QA/QC manual.
This test, which investigates the average linearity error of the analyzers, is to be performed on all gas analyzer ranges used during the previous quarter.
Where the type of analyzer used does not allow for the use of a test gas (e.g., certain in situ path-type analyzers), an independent check of the performance of the CEM system must be carried out. A check of the response for each gas being measured against an RM or an approved portable analyzer will be satisfactory. The comparison must be carried out over a period of not less than 15 minutes for each test run. Three such comparisons will be deemed to be equivalent to the cylinder gas test.
6.3.1.1 Frequency A three-level cylinder gas test must be performed in each quarter of the calendar year, with tests being no closer than 30 days apart for two adjacent quarters, using the following test gases and procedures. In peaking EGUs, this test must be performed annually, immediately before the relative accuracy test period (RATA).
6.3.1.2 Test Gases Protocol gases at low (0–20% FS), mid (40–60% FS) and high levels (80–100% FS) for each gas analyzer must be used.
6.3.1.3 Calibration Gas Injection Port The test gases must be introduced at the CEM system calibration gas port specified in Table 2 (Section 3.1.1).
6.3.1.4 Test Procedures During the test, all pressures, temperatures, and flows must be within the operating parameters of the CEM system. Each test gas must be introduced and the system response allowed to stabilize, then the concentration of the gas indicated by the data acquisition system output must be recorded. The three ranges for each gas must not be introduced in succession or in the same sequence, but must be alternated with other reference gases.
Further details on the use of stack gas moisture monitoring systems are presented in Section 7.
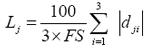
6.3.1.5 Calculations The average linearity error for the responses to each of the low-, mid-, and high-level test gases must be calculated using Equation 17.
Equation 17
where:
Lj = linearity error of the low-, mid-, or high-level calibration, in %
FS = full-scale value of the tested CEM range, in %
dji = difference between the low-, mid-, or high-level reference gas and the corresponding CEM system measurement for the ith test run, in ppm or %
j = low-, mid-, or high-level reference gas
i = 1 of 3 injections of each low-, mid-, or high-level reference gas
6.3.1.6 Acceptance Criteria The average linearity error must not exceed:
Gas analyzer
Low level: 1.0% CO2 (or O2)
Mid level: 1.0% CO2 (or O2)
High level: 1.0% CO2 (or O2)
Stack gas moisture monitor (wet O2 system)
Low level: 1.0% O2
Mid level: 1.0% O2
High level: 1.0% O2
6.3.1.7 Alternative quarterly test Where the type of CEM system does not allow a test gas to be used (e.g., certain in situ path-type analyzers), an alternative validation test on the CEM system performance must be carried out by the operator every quarter, when the EGU is operational. The procedures of this alternative quarterly test are described below.
A portable analyzer that meets the specifications of Environment Canada's Reference Method EPS 1/RM15 must be used to compare the response for each gas being monitored.
The portable analyzer must be calibrated in the field, as per the manufacturer's recommended procedure, with low-level and high-level U.S. EPA protocol grade gases (as described in Table 5). The analyzer must then be fed a stack gas sample extracted from a point within 0.3 m from the CEM sensing point or path. After a stabilization period, the measurements from the portable analyzer must be logged every 30 seconds, for a minimum period of five minutes. Then the analyzer must be fed low-level calibration gas or filtered ambient air until stable readings are obtained.
The low-level drift must be recorded. The stack gas extraction and logging must be repeated for a second sampling period of the same duration, and so on, for a minimum total of six test periods. Finally the analyzer must be fed high-level calibration gas until stable readings are obtained. The high-level drift must be recorded. The relative accuracy of the concurrent CEM measurements must be calculated using equations 4 to 7 (Section 5.3.4.6).
The relative accuracy for a CO2 or (O2) gas analyzer must not exceed 15% or 0.5% absolute difference (|d|), whichever is greater.
6.3.1.8 Out-of-Control Period An out-of-control period occurs when a cylinder gas test exceeds the specification as presented in Section 6.3.1.6 or Section 6.3.1.7, as applicable. This period begins the minute after the completion of the test and ends the minute after corrective action has been taken and when the system has demonstrated that it meets the specification as presented in Section 6.3.1.6 or Section 6.3.1.7. When an analyzer or system is out-of-control, the data generated by the specific analyzer or system are considered missing and do not qualify as meeting the requirement for system availability. Missing data must be backfilled using the criteria provided in Section 3.5.2.
The stack gas flow monitor must be tested quarterly by the operator, using one of the four following options:
Option A evaluation of flow-to-output quarterly data
Option B evaluation of heat-to-output quarterly data
Option C performance of abbreviated flow-to-output or heat-to-output tests; or
Option D performance of flow RM tests
One of options A to D must be selected, taking into consideration the operating conditions of the EGU during the quarter, including type and variety of fuel(s) combusted, the output types (steam versus electricity), the operating mode (base load versus peaking), and the estimated measurement accuracy of flow-related parameters.
Options A and B are only applicable if the quarter includes a minimum of 168 hours of valid CEM data at electric output levels within 10% of the average output of the last RATA. Where these conditions cannot be met, options C or D must be used.
Procedures for options A to D are outlined in sections 6.3.2.4 to 6.3.2.7 respectively.
6.3.2.1 Frequency A stack gas flow test must be performed in each quarter of the calendar year, with tests being no closer than 30 days apart for two adjacent quarters. In peaking EGUs and bypass stacks this test may be performed only once per year.
6.3.2.2 Acceptance Criteria Acceptance criteria for options A to D are presented at the end of each of sections 6.3.2.4 to 6.3.2.7.
6.3.2.3 Out-of-Control Period An out-of-control period occurs when a stack gas flow test exceeds the specifications presented in sections 6.3.2.4 to 6.3.2.7, as applicable. This period begins the minute after the completion of the test and ends the minute after corrective action has been taken and the system has demonstrated that it meets the applicable specifications presented in sections 6.3.2.4 to 6.3.2.7. When a flow monitor is out-of-control, the data generated by the flow monitor are considered missing and do not qualify for meeting the requirement for system availability. Missing data must be backfilled using the criteria provided in Section 3.5.2.
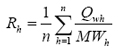
6.3.2.4 Analysis of Flow-to-Output The average flow-to-output ratio is calculated using Equation 18.
Equation 18
where:
Rh = average value of flow-to-electric-output ratio, from the quarterly hours in which the electric output was within 10% of the average electric output during the last RATA in WSm3/h/MW
Qwh = flow from the quarterly hours in which the electric output was within 10% of the average electric output during the last RATA in WSm3/h
MWh = electric output from the quarterly hours in which the electric output was within 10% of the average electric output during the last RATA in MW
n = number of quarterly hours in which the electric output was within 10% of the average electric
output during the last RATA, n≥168
Periods of diverse fuel blends, output ramping, scrubber bypass, or other non-representative hourly data must be excluded from the calculation of average Rh. In peaking EGUs, the potential data base must include all the preceding 12 months of unit operation.
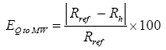
EQ to MW, the absolute percent difference between Rh and Rref (the latter based on previous RATA data and calculated with Equation 8), is calculated using Equation 19.
Equation 19
Acceptable flow-to-output results are as follows:
EQ to MW ≤10% for output levels ≥60 MJ/s
EQ to MW ≤15%, for output levels <60 MJ/s
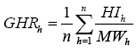
6.3.2.5 Analysis of Heat Input to Electric Output Data The hourly heat inputs must be calculated with one of equations 9 to 12 (as applicable) and the average heat-input-to-electric-output ratio (or gross heat rate in GHRh) must be calculated using Equation 20.
Equation 20
where:
GHRh = average value of gross heat rate from the quarterly hours in which the electric output was within 10% of the average electric output of the last RATA in GJ/MWh
HIh = gross heat input from the quarterly hours in which the electric output was within 10% of the average electric output during the last RATA in GJ/h
MWh = gross electric output from the quarterly hours in which the electric output was within 10% of the average electric output during the last RATA in MW
n = number of quarterly hours in which the electric output was within 10% of the average electric
output during the last RATA, n≥168
Periods of diverse fuel blends, output ramping, scrubber bypass or other non-representative hourly data may be excluded from the calculation of average GHRh. In peaking EGUs, the potential data base must include all the preceding 12 months of unit operation.
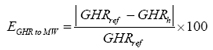
EGHR to MW, the absolute percentage difference between GHRh and GHRref (the latter based on RATA data and calculated with Equation 13), is calculated using Equation 21.
Equation 21
Acceptable heat-to-output results are as follows:
EGHR to MW ≤10%, for input levels ≥171 MJ/s
EGHR to MW ≤15%, for input levels ≥171 MJ/s
6.3.2.6 Performance of Abbreviated Flow-to-Output or Heat-to-Output Tests An abbreviated flow-to-output test consists of a period of 6 to 12 consecutive hours during which the process conditions reproduce as closely as practicable the conditions of the most recent flow RATA. The output must be held constant to within 10% of the average output during the last flow RATA and the CO2 or O2 to within 0.5% of the corresponding level.
For a flow-to-output test, for this period, Rh is calculated using Equation 18 and EQ to MW using Equation 19. Acceptable EQ to MW levels are the same as in Section 6.3.2.4.
For a heat-to-output test, for this period, GHRh is calculated using Equation 20 and EGHR to MW using Equation 21. Acceptable EGHR to MW levels are the same as in Section 6.3.2.5.
6.3.2.7 Performance of Flow Reference Method Measurements This test must be carried out using Method B from Reference Methods for Source Testing: Measurement of Releases of Particulate from Stationary Sources (Environment Canada, December 1993, as amended). Wall effects and complex velocity patterns must be determined with U.S. EPA Methods 2H, CTM-041 and 2F/2G. The audit comprises three consecutive RM measurements. CO2, O2, and moisture values from a certified CEM system may be used for calculating molecular weights during this testing.
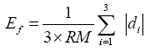
Ef is calculated using Equation 22.
Equation 22
where:
Ef = average of the absolute difference between the RM value and the corresponding CEM system flow measurement
di = difference between an RM value and the corresponding CEM system measurement for the ith test run in m/s or m3/s
RM = average gas velocity or flow rate, as measured by the reference method in m/s or m3/s
Acceptable results are as follows: Ef ≤ 6% of FS, or average |di| ≤ 1.2 m/s.
Two test procedures are involved in the semi-annual performance evaluation: a relative accuracy test and a bias test. They are carried out for each gas measured, as well as for stack gas flow and stack gas moisture (if the CEM system is fitted with stack gas flow and moisture monitors).
6.4.1.1 Frequency and Timing of Evaluations A performance evaluation must be carried out twice a year, no less than four (4) months apart.
6.4.1.2 Test Gases The gases used by both the CEM system and the RM during the RA test must be U.S. EPA protocol grade.
6.4.1.3 Test Procedures Relative accuracy and bias must be tested according to procedures and calculations in Section 5.3.4 and Section 5.3.5. Only one capacity level needs to be tested.
Further details on the use of stack gas moisture monitoring systems are presented in Section 7.
6.4.1.4 Acceptance Criteria The following performance specifications must be met, providing that the CEM system includes the monitored parameter.
Relative accuracy
The relative accuracy for a CO2 (or O2) monitor must not exceed 10% or 0.5% CO2 (or O2) average absolute difference (|d|), whichever is greater.
The relative accuracy for a stack gas flow monitor must not exceed 10% or 0.6 m/s average absolute difference (|d|), whichever is greater.
The relative accuracy for the stack gas moisture monitor must not exceed 10% or 2% of (100-Bws), whichever is greater.
The relative accuracy for CO2 mass emissions must not exceed 10%.
Meeting the relative accuracy for CO2 (or O2), moisture and stack gas flow does not guarantee meeting the relative accuracy for CO2 mass emissions.
Bias
The bias for a CO2 (or O2) monitor must not exceed 5.0% of the FS value or 0.5% CO2 (or O2) average absolute difference when no bias adjustment factor (BAF) is used, whichever is greater.
The bias for a stack gas flow monitor must not exceed 5.0% of the FS value or 0.6 m/s average absolute difference when no BAF is used, whichever is greater.
The bias for a stack gas moisture monitor must not exceed 5.0% of the FS value, or 2% of (100 - Bws) average absolute difference when no BAF is used, whichever is greater.
If there is any bias, as defined in Section 5.3.5, either positive or negative, in any measurements made by the CEM system, then the data that are subsequently generated must be corrected for the bias before any subsequent use is made of the data.
6.4.1.5 Out-of-Control Period An out-of-control period occurs when the relative accuracy or bias tests exceed the specifications as presented in Section 6.4.1.4. This period begins with the minute after the completion of the test and ends with the minute after corrective action has been taken and the system has demonstrated that it meets the specifications presented in Section 6.4.1.4. When an analyzer, monitor, or system is out of control, the data generated by the specific analyzer, monitor, or system are considered missing and do not qualify as meeting the requirement for system availability. Missing data must be backfilled using the criteria provided in Section 3.5.2.
The semi-annual test may be waived and conducted annually after the first year of operation if all of the following criteria have been met:
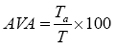
The percentage availability for the system, for each gas or moisture analyzer, and for the flow monitor is calculated annually using Equation 23.
Equation 23
where:
AVA = availability of the system, gas analyzer, or flow monitor in %
Ta = number of hours during which a) the EGU burned fuel and b) the system, gas analyzer or flow monitor generated data that met the valid hourly requirements of Section 3.5.1
T = total number of hours during which the EGU burned fuel during the year
The availability of the system, gas analyzers, and stack gas flow monitor must be at least 90% annually for the first full year of operation and 95% annually thereafter. The availability for EGUs must be at least 80% annually. Data that are backfilled using a procedure other than a certified alternative CEM system cannot be credited towards meeting the CEM system availability criteria.
When a CEM system is unable to meet the above annual availability criteria, then the cause of the out-of-control periods must be investigated and an action plan to prevent and/or repair recurrent failures must be prepared and recorded in the QA/QC manual.
A CEM system that fails to meet the annual availability criteria on two successive years must be repaired or replaced and in either case recertified.
The CEM system and the QA/QC program must be evaluated by an auditor every 12 months (+/- ) 1 month.
The auditor must review the QA/QC manual, the CEM system operation, reports, and other associated records to determine if the procedures in the QA/QC manual are being followed. The auditor must also note any changes in the system or the procedures since the last yearly evaluation and ensure that they have been included in the QA/QC manual.
When components of the CEM system are replaced or modified in a manner that affects the ability to comply with this RM (e.g. replacement of the analyzer, change in the location or orientation of the sampling probe or the complete replacement of the CEM system), or when the EGU is modified in a manner that affects the ability of the CEM system to comply with this RM, the certification of the affected components must be repeated according to the procedures of Section 5. The recertification must be completed within 30 days.